Thermal + RGB
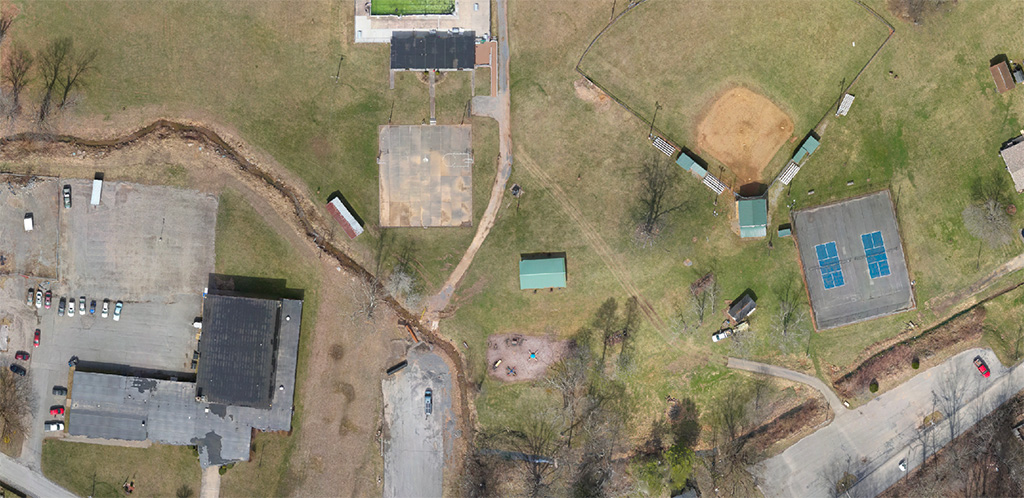
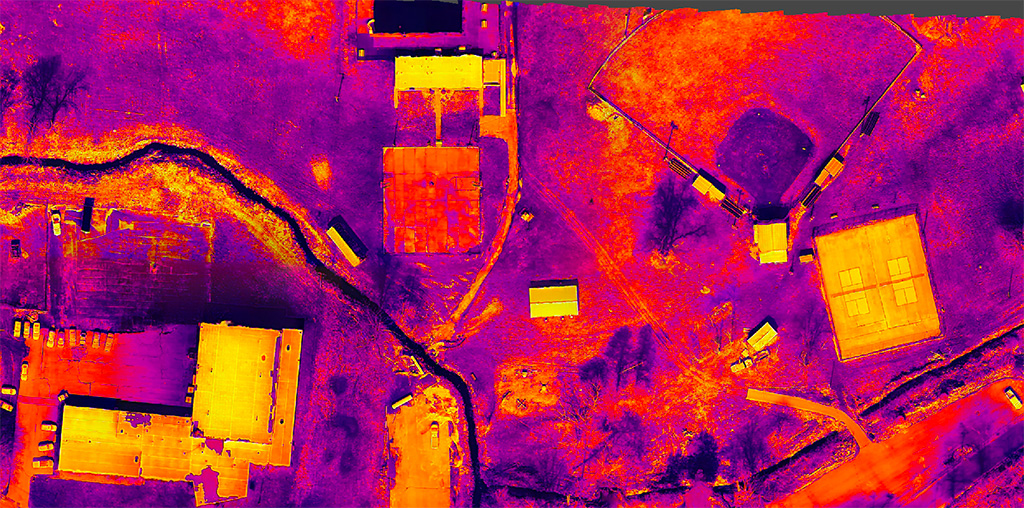
Above s a sample of work where we discovered the path of a water leak and were able to trace it back to the origin.
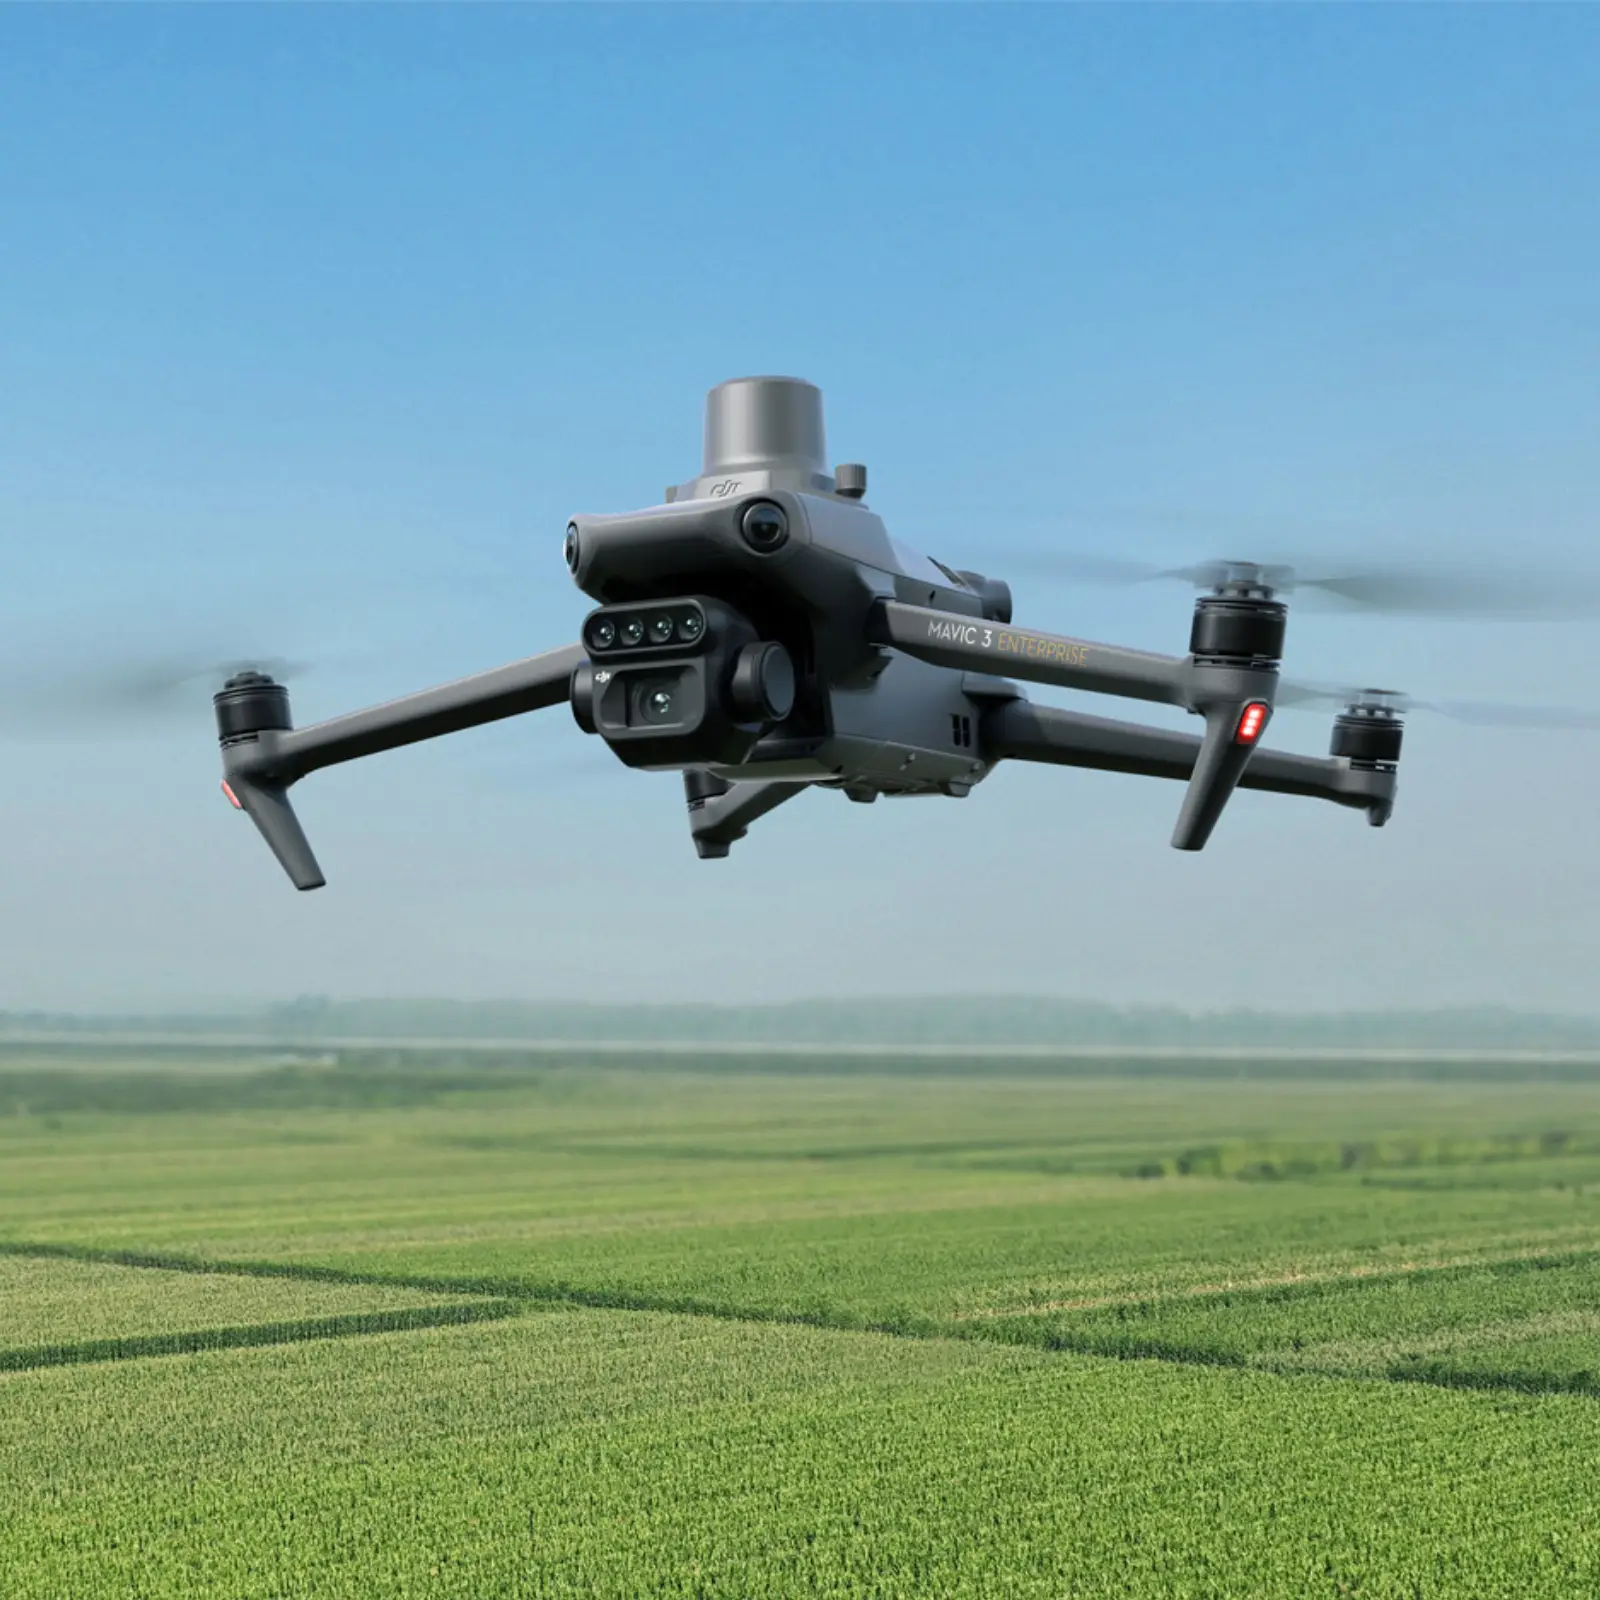
Using Abigail, one of our drones equipped with RGB (and thermal) cameras, inspectors can capture high-resolution, color images that closely resemble what the human eye sees. These images allow for a clear visual record of surfaces, structures, and materials, helping inspectors easily spot visible defects such as cracks, corrosion, or other physical damage. The use of drones means that even hard-to-reach or hazardous areas can be quickly and safely surveyed, reducing the need for manual inspections and lowering the risks to human workers.
Thermal imaging, on the other hand, provides valuable temperature data that can reveal issues not visible in regular photographs. By detecting differences in heat, thermal cameras can identify areas of poor insulation, overheating components, or moisture intrusion in buildings and infrastructure. This type of imaging helps pinpoint potential problems early, allowing for more targeted maintenance or repairs before minor issues escalate into major failures. Combined, RGB and thermal imaging offer a comprehensive overview, improving the accuracy and efficiency of inspection work.
Multispectral for Agriculture
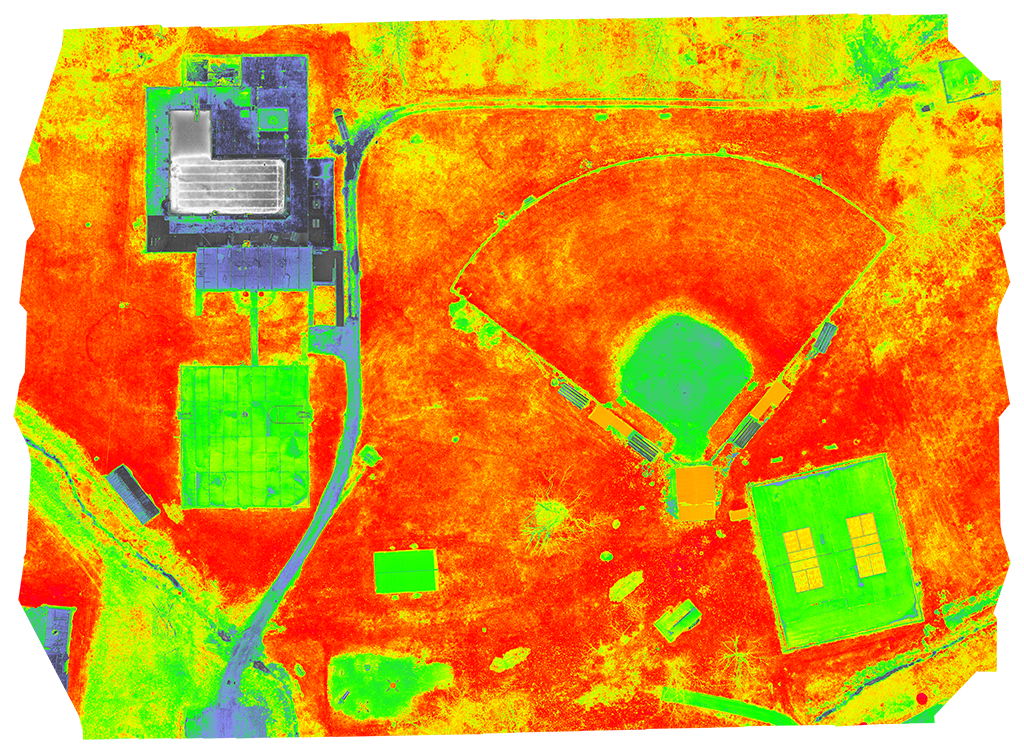
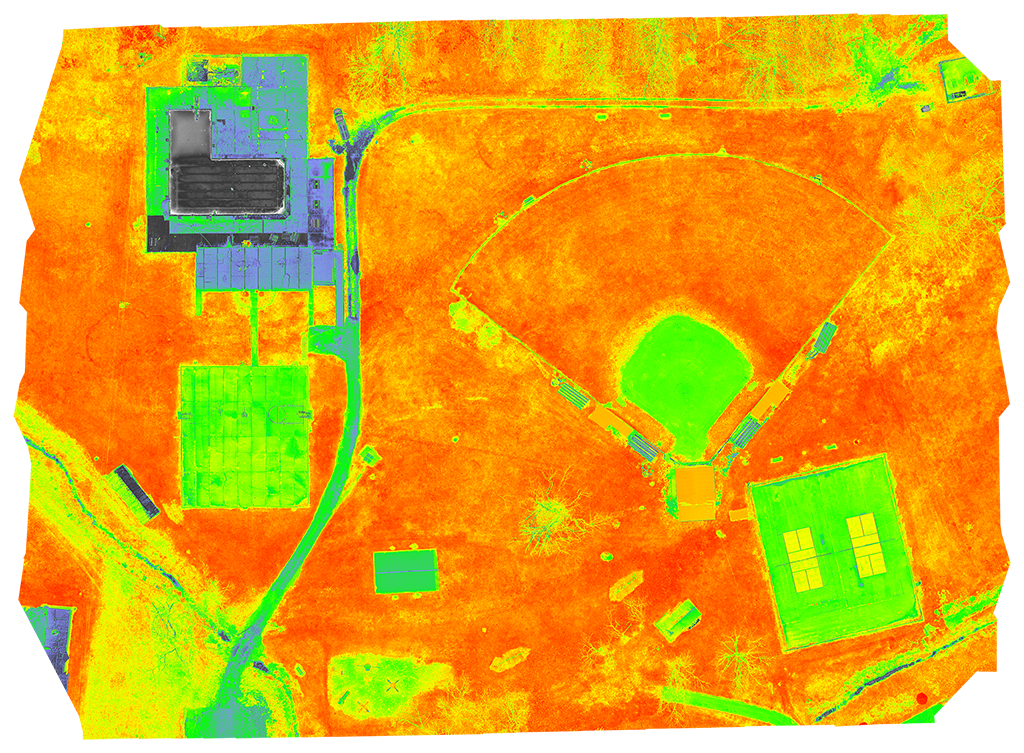
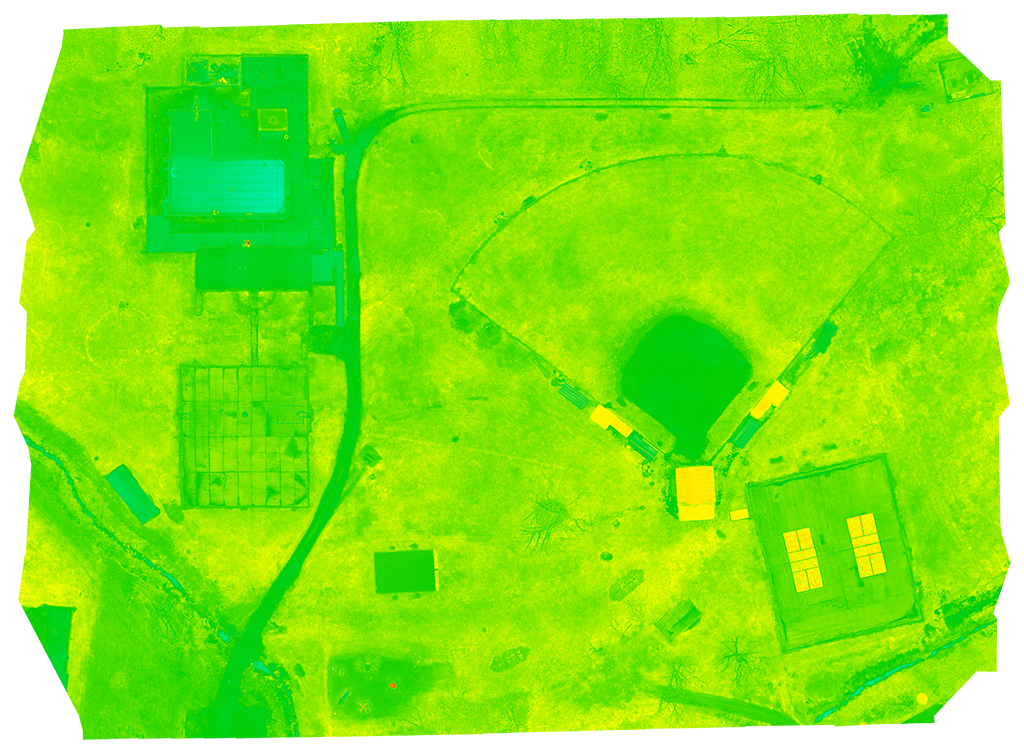
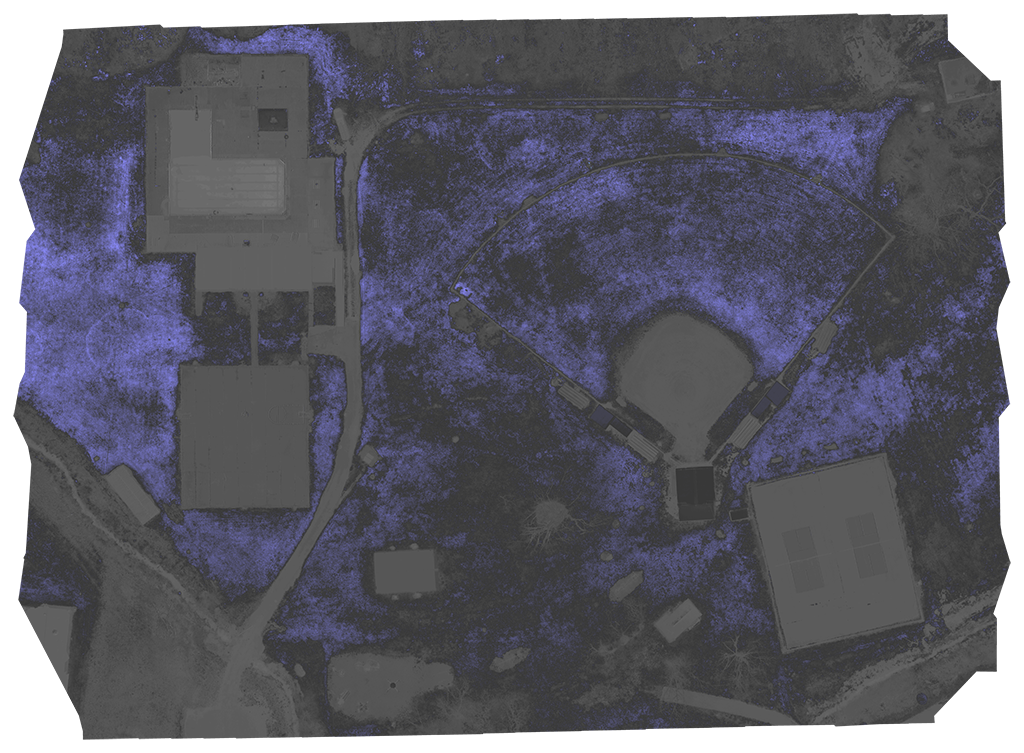
Bruce, our DJI Mavic 3 Multispectral features several camera sensors that capture images in different parts of the light spectrum. It includes a standard RGB camera, which produces images similar to what the human eye sees, providing an accurate view of the field’s appearance. In addition, the drone is equipped with sensors for capturing red edge and near-infrared images. These specialized sensors gather data that is not visible to the naked eye, offering valuable insights into plant health by detecting variations in chlorophyll and moisture levels.
By analyzing the data from these different image types, farmers and agronomists can better understand crop conditions and make informed decisions. For example, near-infrared images are often used to calculate the Normalized Difference Vegetation Index (NDVI), which highlights areas of plant stress or vigor. Red edge imagery, on the other hand, is sensitive to subtle changes in chlorophyll content and can indicate nutrient deficiencies. Combined, these data sources enable more precise field inspections, allowing for targeted interventions that can lead to improved crop management and increased yields.
